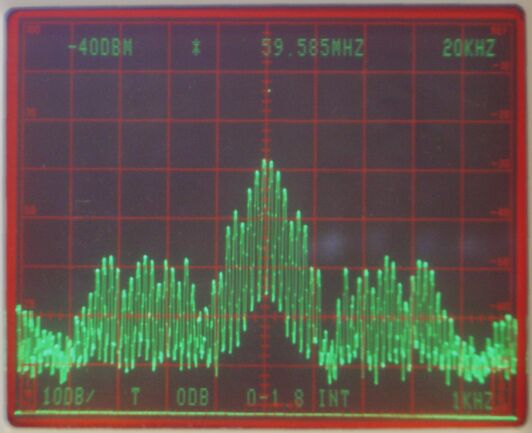
Third order intermodulation vs signal levelConventional receivers suffer from third order intermodulation (IM3) at high signal levels. Inside any device that is not perfectly linear currents of the second harmonics of strong signals will circulate. These second order products will mix with other signals to produce third order interference at frequencies 2F1-F2 2F2-F1When testing receivers one makes the amplitude of F1 and F2 equal and then the third order intermodulation product typically follows the amplitude to power three. This means that IM3 is reduced by 30 dB when the test signals are reduced by 10 dB and that the IM3 products disappear completely when the test signals are reduced one third of the way between total breakdown and the noise floor. Analog receivers have an intermodulation-free dynamic range. For more details, look here: Intermodulation in analog receivers Digital receivers behave differently. There are two distinctly different mechanisms that generate interference at the same frequency where we expect IM3. One mechanism is the non-linearity of the A/D converter which can not be described well with a polynomial (see the above link) and therefore does not follow the third order law. An A/D converter might have an error in the order of 0.5 or 1 bit when it steps from a binary value like 011111111111 to 100000000000. Such points of non-linearity may be located close to zeroand even small signals become affected by it. The amplitude of the generated interference is essentially independent of the signal level. Another mechanism is coupling from the data bus to the A/D input. With a test signal at F1 and a sampling clock at Fs the digital data lines that send the data from the A/D converter to the first data processing chip will contain strong components of Fs+F1, Fs-F1, 2Fs+F1, 2Fs-F1,..... The analog bandwidth of a radio A/D converter is typically large enough to give full sensitivity to all these frequencies. They seem to be signals at F1 due to aliasing effects but since they vary in amplitude in a strongly non-linear fashion they create a non-linear behaviour. The phenomenon is illustrated in figure 1 which shows a spectrum analyzer screen of a signal picked up by holding a probe near the AD644 in an SDR-14 when subjected to a two-tone test. The details of such spectra depend on signal levels as well as on which lines on the data bus that couple best to the probe. |
|
|
|
Fig. 1. The data pins of an A/D converter carry
high frequency signals.
This spectrum is picked up with a capacitive probe close
to the AD6644 in an SDR-14 that samples at 66.667 MHz.
Two test signals at 7.0800 and 7.0828 are sent into
the antenna input.
At the same time as the signal shown in figure 1 was picked up, Linrad was used to process the output from the SDR-14. Figure 2 shows the screen dump from Linrad. The similarity of the spectra is obvious. The level of the IM3 signal is fairly independent of the signal level. In figure 2 it corresponds to about -85 dBm for an input signal level of about -35 dBm. Saturation occurs at about -7 dBm. If these numbers were used to compute IP3 according to the third order law one would get -10 dBm and +32 dBm respectively. It is obvious that the SDR-14 does not have an IP3. The signal at the IM3 frequency is probably dominated by noise pick-up from the databus. |
|
Fig. 2. The spectrum displayed on the Linrad
screen when processing the SDR-14 signal generated
while figure 1 was produced.
Performance of the SDR-14 with real signals from an antennaTo demonstrate the effect of the intermodulation-like interferences in the SDR-14 in real life, two instances Linrad were run simultaneously under X11. One using the SDR-14 hardware, the other using the WSE converters and a Delta 44 soundcard. Both systems were connected to the same antenna through a hybrid, an attenuator and a preselector as illustrated in figure 3. |
|
|
Fig. 3. Setup to compare an SDR-14 to a WSE
converter system.
The 1 dB attenuator in front of the SDR-14 serves to make the noise figure identical for the two receivers. Both of them have a noise figure of about 17 dB as measured at the input of the hybrid. With zero attenuation in the stepped attenuator the noise figure at the antenna input is 5.5 dB and then the noise floor in both systems is raised by 15 dB. The frequency response of the preselector is shown in figure 4. The 3 dB bandwidth is about 0.5 MHz and the maximum gain is 26 dB. The antenna was a wire about 5 metres above ground with a length of about 10 metres. With zero attenuation the signal level from the antenna, occasionally makes the red light indicating saturation go on for very short times. No adverse effects from these short periods of saturation could be seen on the Linrad screen. A single signal fed into the antenna input turns on the saturation indicator on the SDR-14 at a level of -33 dBm and that is therefore the peak power level that the test antenna occasionally can produce when many BC stations happen to be strong and in phase simultaneously. |
|
|
Fig. 4. Preselector frequency response.
According to an article by Peter Chadwick, G3RZP, HF Receiver Dynamic Range: How Much Do We Need? QEX May/June 2002, p36-41, the required dynamic range on 40 m is 96 dB. This number is evaluated under the assumption that regular intermodulation is the limiting phenomenon when two signals at -15 dBm give IM3 while the noise floor is at -101 dBm. This happens at 2255 according to table 1 in Peters article. The summed peak power of two signals at -15 dBm is -9 dBm and in order to accomodate this power the stepped attenuator of figure 3 would have to be set at 24 dB which would degrade the noise figure to about 15 dB. This is 14 dB better than required according to Peters article. Since saturation is the limiting case rather than intermodulation the margin is smaller at 1715 according to Peters data. Five signals at -15 dBm will give a peak power of -1 dBm occasionally which would call for an attenuator setting of 32 dB with a noise figure of 25 dB. This is only 7 dB below the required noise figure but still a respectable margin. The screen dumps below show very clearly that the SDR-14 has to be run with strong signals that lift the noise floor above the level of the data-bus interference. |
|
|
Fig. 5.WSE and Delta44 on top with a total
bandwidth of 96 kHz. SDR-14 below with a total
bandwidth of 189.4 kHz.
The frequency scales are similar so the SDR-14 waterfall
is twice as wide.
The attenuation is 80 dB for a NF of 71 dB.
The carriers of the AM broadcast stations are visible about
40 dB above the noise floor.
The DC component of the Delta44 is at 7.075 MHz while the
much weaker DC component of the SDR-14 is at 7.100 MHz.
The SDR-14 has a spur of unknown origin at about 7.070MHz.
The only signal within the amateur band is at 7.054 MHz.
Both systems work without interferences at this very low
signal level.
|
|
|
Fig. 6.The attenuation is 70 dB for a NF of 61 dB.
Signals are (of course) 10 dB stronger compared to
figure 6.
|
|
|
Fig. 7.The attenuation is 60 dB for a NF of 51 dB.
The signals are now strong enough to cause the noise on the
data bus of the SDR-14 to be synchronous with 5 kHz,
the channel separation between AM broadcast stations.
There are false carriers every 5 kHz in the SDR-14.
The noise floor has also rised slightly because all
the AM modulation sidebands also contribute.
|
|
|
Fig. 8.The attenuation is 50 dB for a NF of 41 dB.
The false carriers at every 5 kHz in the SDR-14 are
stronger, one or two more lines on the data bus
have became active to produce more interference power.
This image was captured too soon after starting Gimp
(a Linux program to capture screen dumps) and therefore
the waterfalls have not been properly updated.
There are many enough signals however to allow a comparision
in those time intervals shown in both waterfalls.
|
|
|
Fig. 9.The attenuation is 40 dB for a NF of 31 dB.
The zero point for the colour scale is shifted by 5 dB.
The noise floor has increased slightly due to the noise picked
up by the antenna, but it is quite clear that the SDR-14
has a degraded noise floor and that it suffers from false
signals caused by the AM broadcast stations.
The SDR-14 uses USB to send data to the PC in a 16 bit format.
Figures 5 to 8 did not use any output shift (OL_RCF=0)
but in order to accomodate the data within 16 bits the output
was left-shifted by two bits for this screen dump.
To compensate for the reduced system gain the zero point of
the Linrad colour scale was changed by 12 dB.
|
|
|
Fig. 10.The attenuation is 30 dB for a NF of 21 dB.
The zero point for the colour scale is shifted by 8 dB
compared to figure 9.
The noise picked up by the antenna contributes significantly
to the noise floor.
Only the stronger false signals caused by the AM broadcast stations
are visible.
|
|
|
Fig. 11.The attenuation is 20 dB for a NF of 11 dB.
The zero point for the colour scale is shifted by 13 dB
compared to figure 9.
The noise picked up by the antenna now dominates the noise floor,
but the stronger false signals caused by the AM broadcast stations
are still visible.
|
|
|
Fig. 12.The attenuation is 10 dB for a NF of 7 dB.
The zero point for the colour scale is shifted by 23 dB
compared to figure 9.
With the antenna noise placed 10 dB higher than in figure
11, the false signals are now below the noise floor.
At this point the SDR-14 has a margin to saturation of
about 10 dB.
|
|
Fig. 13.No attenuation. The NF is 5.5 dB.
The zero point for the colour scale is shifted by 33 dB
compared to figure 9.
The output of the SDR-14 is shifted by 4 bits here and
the WSE RXHFA preamplifier gain is reduced by 5 dB.
The AD6644 of the SDR-14 saturates occasionally but
the interference generated is not visible.
The antenna noise floor is so high that much stronger
interferences are needed to be visible.
ConclusionsReceivers using VHF-sampling A/D converters suffer from interference caused by signal pick-up from the data bus and/or by non-linearities in the digitalisation process. Such interference is essentially independent of the signal levels and it is necessary to put an amplifier in front of a unit such as the SDR-14 to lift the noise floor high enough to make the false signals disappear below the noise.The need to lift the noise floor by about 25 dB reduces the seemingly excellent dynamic range by lifting the noise floor from -152 dBsat/Hz to -127 dBsat/Hz. This is still quite respectable, not very different as compared to conventional amateur transceivers on HF bands. On VHF and UHF where one wants an ultra-low noise figure for EME, satellite and weak signal communication, one has to lift the noise floor by about 15 dB anyway to make the mast-mounted preamplifier dominate the noise completely. Some noise from additional amplifiers and converters easily places the noise floor at about -127 dBsat/Hz In case the dynamic range of 127 dB is inadequate one can remove the false signals by dithering. A quasi-random signal (noise modulated FM outside the interesting frequency band) with an amplitude that spans 50% of the A/D converter transfer function will reduce the point of saturation by 50% or 6 dB. The intermodulation-like interference would be spread out to cause a noise floor increase in the order of 3 dB so the improvement in dynamic range would be about 15 dB compared to removing the interference with a simple amplifier that just lifts the noise floor. The digital technology develops however. It is possible to add and subtract random noise at various places to improve performance of a VHF sampling A/D converter. Chips like LTC2207/LTC2206 use such randomisation and should have a much better performance than the AD6644. Besides the AD6644 the SDR-14 contains an AD6620 that reduces the sampling rate from 66.667 MHz to some value that fits a PC computer. The AD6620 does not allow filter that removes all spurs when a wide passband like 200 kHz is sent to the PC. The purpose of the preselector is to remove all resampling spurs and to protect the AD6644 from the needless signal voltages due to signals far away from the amateur band. It is obvious that a narrower preselector would make the dynamic range margin much larger on the 40 m amateur band. The preselector also has an adverse effect. It removes the noise outside the desired passband that would have helped to randomise the interference by dithering. Receiver testingOne of the key figures of merit for a receiver is the dynamic range. Generally it is the level above the noise floor undesired signals may have to not cause S/N degradation for a weak desired signal.Measurements on conventional receivers start from the noise floor and increase the undesired signal until degradation of the desired signal is observed. When testing a digital receiver one should do the measurement the other way around by placing the undesired signal at the saturation limit, then look for the placement of the noise floor that will just mask the interference. With reference again to the QEX article by Peter Chadwick it is necessary to shift the dynamic range up or down with amplifiers or attenuators on conventional amateur radio receivers. It is the same with digital receivers, one should just use different criteria for how to set the optimum level. An analog receiver should be adjusted for the antenna noise to just lift the noise floor a little, between 6 and 15 dB depending on circumstances. A digital receiver should be set for the highest signal level that does not cause saturation. To SM 5 BSZ Main Page |