17M2 at 144.0 MHz
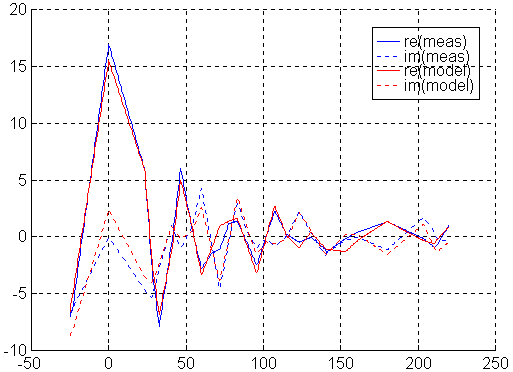
Fig 1. 17M2 at 144.0 MHz.
The vertical scale is Voltage in arbitrary units. Horizontal is angle in degrees.
17M2 at 148.0 MHz.
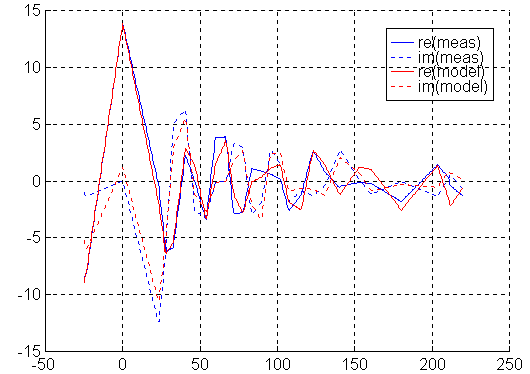
Fig 2. 17M2 at 148.0 MHz.
The vertical scale is Voltage, same units as in fig 1. Horizontal is angle in degrees.
The back lobe of 17M2.
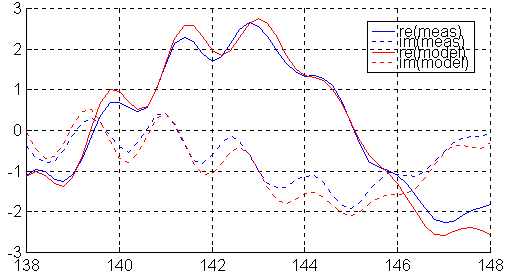
Fig 3. The back lobe of 17M2.
17M2 magnitude of error at all frequencies and directions
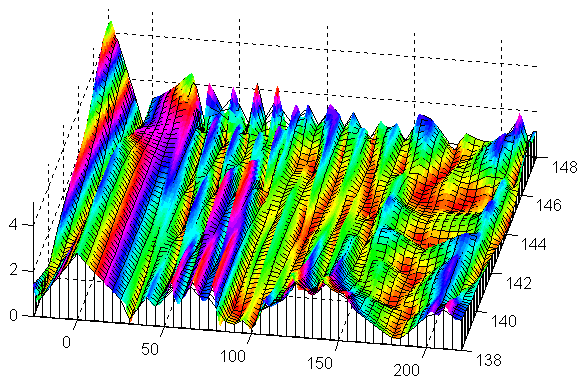

Fig 4. 17M2 magnitude of error at all frequencies and directions.
The vertical scale is Voltage, same units as in fig 1. Horizontal are angle and frequency.
The errors with a magnitude of 3 to 4 units that are visible in fig. 4 do not come from features visible here.
17M2 real part of far field at all frequencies and directions.
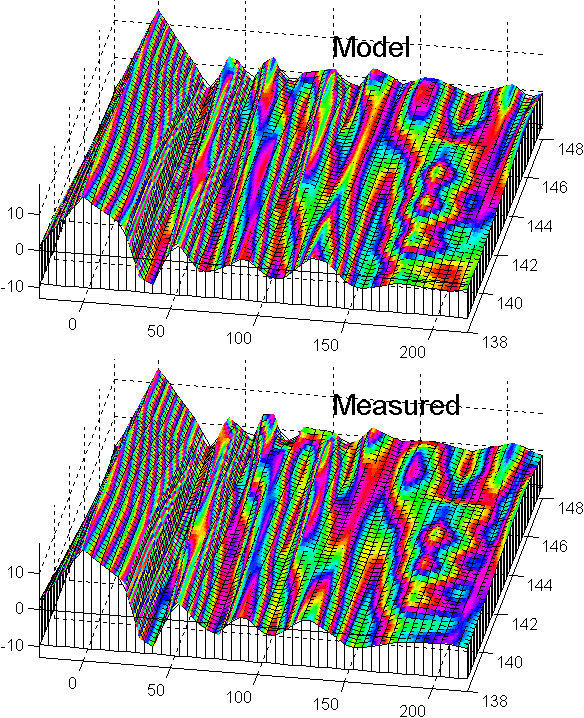

Fig 5. 17M2 real part of far field at all frequencies and directions.
The vertical scale is Voltage, same units as in fig 1. Horizontal are angle and frequency.
Most of the difference between model and measurement in the region of large errors (forward reflection and main lobe) can be seen here. It is essentially an error in the phase angle that varies with frequency. The spacing between the small lobes does not change identically in the model and in the measurement which causes errors around 2.5 units at 138 MHz around 135 degrees.
Probably most of these frequency depending discrepancies can be attributed to inadequacies of NEC2. For a large optimised yagi like 17M2 compensation of systematic errors with a "boom correction" is not perfect over a 10MHz frequency range.
17M2 imaginary part of far field at all frequencies and directions.
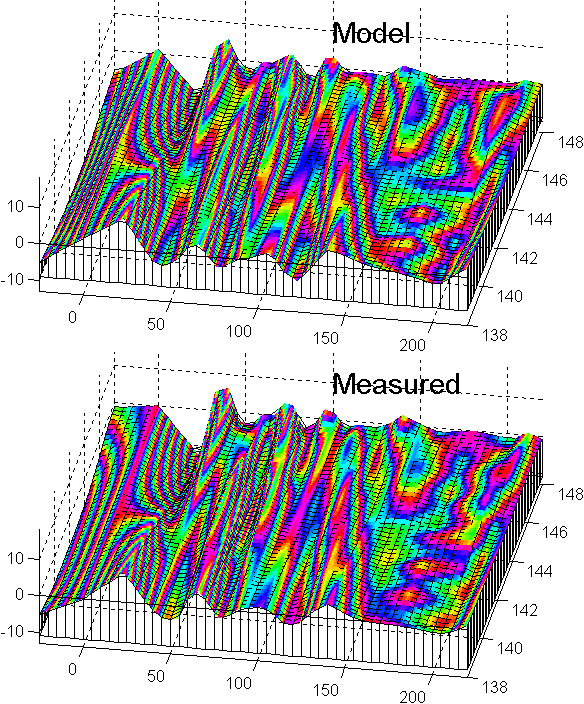

Fig 6. 17M2 imaginary part of far field at all frequencies and directions. The vertical scale is Voltage, same units as in fig 1. Horizontal are angle and frequency. The figure alternates between experiment and model. No particularly interesting difference can be seen.
17M2 in the forward direction at different heights at 144.0 MHz
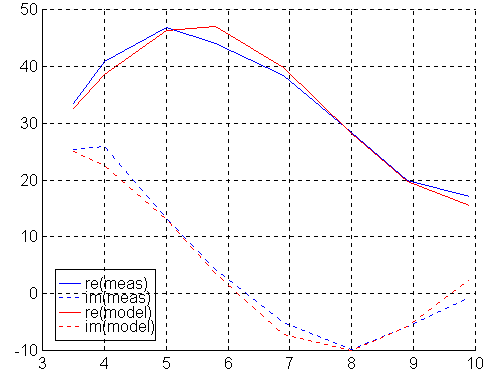
Fig 7. 17M2 in the forward direction at different heights at 144.0 MHz.
At the normal height (10 m) the forward ground reflection and the direct wave are essentially in antiphase. Since the two rays are separated by 17 degrees only, both enter the antenna producing a rather weak signal. At a height of 5 meters the two rays add in phase producing 3 times more signal amplitude or 10 times more power. The model, assuming perfectly flat ground reproduces phase and amplitude changes with height quite well.
17M2 in the forward direction at different heights, real part at all frequencies


Fig 8. 17M2 in the forward direction at different heights, real part at all frequencies. Together fig. 8 and fig. 9 show that the model assuming perfect flat land between the antennas is essentially correct. The signal varies in phase and amplitude as expected.
17M2 in the forward direction at different heights, imaginary part at all frequencies


Fig 9. 17M2 in the forward direction at different heights, imaginary part at all frequencies.
Cartesian plot of radiation pattern for 17M2.
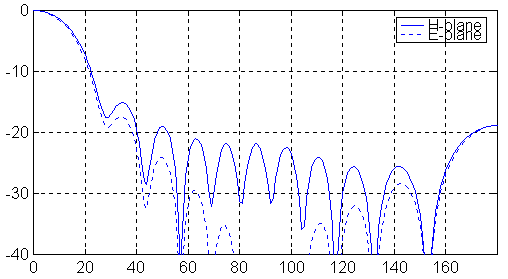
Fig 10. Cartesian plot of radiation pattern for 17M2 at 144.0 MHz.
The small lobes are separated by about 17 degrees, so when one of them looks into the direct beam another looks at the ground reflection. The measurements at variable heights indicate that the amplitude and phase relation between the two rays is essentially correct. At 144MHz the the systematic errors within NEC2 are best compensated with the "boom correction" that was fount to give the best over all fit.
Polar plot of E-plane pattern for 17M2.

Fig 11. Polar plot of E-plane pattern for 17M2.
Polar plot of H-plane pattern for 17M2.

Fig 12. Polar plot of H-plane pattern for 17M2.
Gain vs frequency for 17M2.
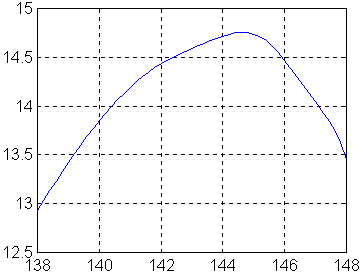
Fig 13. Gain vs frequency for 17M2. The model fits well to measured data, particularly around 144 MHz. f Consequently the errors in these gain figures are very small at this frequency.