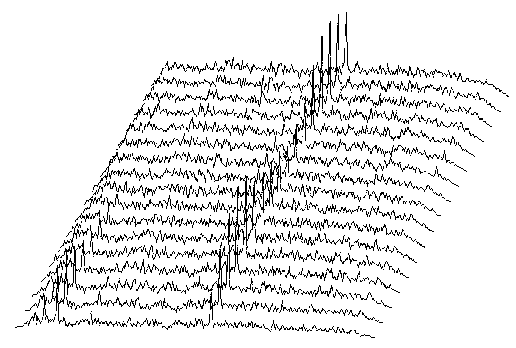
The spectrum analyser I always have in front
of me while working EME looks like this for
the first 10 seconds of the transmission

Spectrum analyser image for the first 10 seconds of station XX. The total width is about 3.5kHz. To the left side you can see the tail of one of the stations calling the expedition at a frequency offset of +1.5 kHz. Each spectrum is a sliding average with a time constant of about 2 seconds. The vertical scale is linear in power and the bandwidth is about 17.
The spectrum shown in the image is 400 points of the 512 point sliding FFT that was used to produce the DSP audio sequence at the bottom of this page. As you can see in the image, (S+N)/N is 6 dB at the peaks, so S/N is about 5dB. This is the average signal level. The peak level is about 8 dB, 3dB has to be added because of the 50% duty cycle of the morse code. As you can see from this figure, the minimum (S+N)/N needed to see a signal is about 1.5dB, so minimum S/N is about -3dB. Here, as in FFTDSP by AF9Y the signal can be seen long before it can be copied. Also when 3dB of S/N is lost, by addition of the noise from the orthogonal polarisation the signal can be seen before it is strong enough to be copied - but the margin is not more than about 3 dB. The spectrum I normally look at when working EME is the sum of the two FFT's from the two orthogonal parts of my cross yagi system. For extremely weak signals I have the option to turn the polarisation plane electronically by turning a potentiometer, and display the FFT at a 3dB better S/N. In the summer 1995 I did not have electronic polarisation control. At that time the Rx polarisation was only switchable in 45 degree steps, so all signals presented on this page are received with the best out of four linear polarisations.
For more info about polarisation, look at Electronic Polarisation Control
The signal coming out into my headphones was recorded by the PC computer using the software that came along with it. The first two files are recorded with a FT221 in CW mode as the receiver. The main content of these WAV files is white noise and the spectrum goes above 2kHz. They can not be compressed with WAVPAC.
The passband of my FT221 is flat from about 500 Hz to 2500 Hz. Having such a passband it would seem natural to place the signal of interest at the centre of the passband. Listen to this WAV file FT221MID.ZIP (494k bytes) in which the audio frequency of the signal is about 1500 Hz. Although I know who the station is, I can not honestly say that I can copy it from this file by ear. I can hear fragments - and by listening several times I can convince myself that I do hear the right thing. Maybe your ears are better ??
Experienced operators know that a low pitch makes things easier. The next file is with the FT221 tuned for the audio frequency to become about 700 Hz, the point where the amplitude starts to drop. Listen to this WAV file FT221LOW.ZIP (492k bytes) Just by shifting to a lower pitch, the signal comes out of the noise a little bit better, and from this audio sequence I can definitely copy the call sign. Can you ?? (Remember I have the advantage knowing who it is !!)
The next version is the same sequence using the filter with 2 * 100 kHz calibrator X-tals. The bandwidth is set to about 1200Hz and the pitch is the same as in the previous example, about 700Hz. Listen to XX1200.ZIP (441k bytes) To me this reduction of bandwidth makes a small step in the right direction. Copying is definitely easier, and I get a slightly larger part of the transmission.
Still with the same pitch, 700Hz, here is the same sequence with a bandwidth of about 50Hz. Listen to XX50M.ZIP (31k bytes) The signal here sounds better, but it is hard to really copy much more. (Note that WAVPAC. compressed a little too much - the bandwidth here is slightly reduced compared to the original WAV file. To get closer to original signal, unpack the next file with frequency shift)
With the same bandwidth, but frequency shifted down to about 250 Hz the signal sounds like this: XX50L.ZIP (63k bytes) Another very small improvement.
A further reduction of the bandwidth to about 25Hz clearly makes copying easier for me - but maybe this is different for different persons. XX25L.ZIP (16k bytes) Allows you to see what you think. At this bandwidth tuning is more difficult. The frequency stability is not good enough. I had to retune halfway through the transmission to keep the signal reasonably well within the passband.
The signal in this example is a limiting case for my digital processing system. Firstly, the speed is relatively fast for a marginal EME station Secondly the frequency stability is not really good enough for the primitive algorithms I presently use. Nevertheless I find it slightly easier to copy the signal from the computer. XXDSP.ZIP (16k bytes) Note the funny sound halfway the sequence when the tuning is wrong, and how it despite the primitive algorithms becomes right again. While the tuning is wrong, the phase is not continuos because the proper phase is no longer extracted from the sine and cosine coefficients of the fourier transform, and these coefficients are used to set amplitude and phase of the continuously running oscillator. The amplitude is expanded with approximately an exponential function, and limited at a level not very far above the peak value of the pure noise. The bandwidth is about 17 Hz. For details, look at Sliding FFT and DSP Filtering.